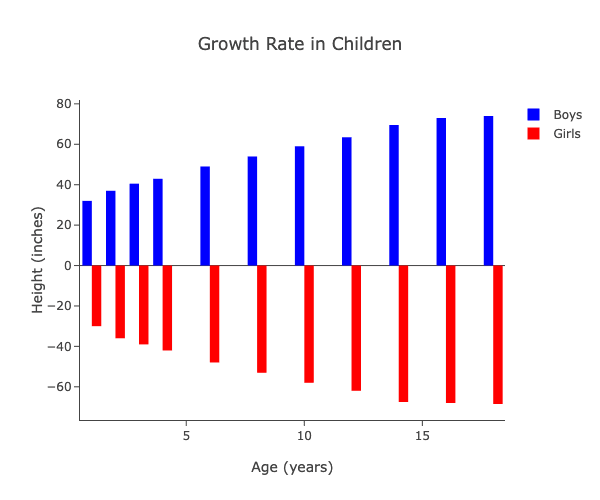
With PlotData you can easily make customisable publication-quality charts, all without programming skills.


Overview:
- Step 1: Upload a csv file
- Step 2: Select the type of chart
- Step 3: Choose the variables you want to plot
- Step 4: Give labels to axes
- Step 5: Give a title to the chart
- Step 6: Assign properties to the chart
Et voila! An interactive chart gets generated, with the help of the
Plotly JavaScript library.
- You can export the chart as png image to share with others or include in reports or presentations
- You can also choose different values for the fields in the previous steps and regenerate the chart
You can find here a CSV file for testing the process.
